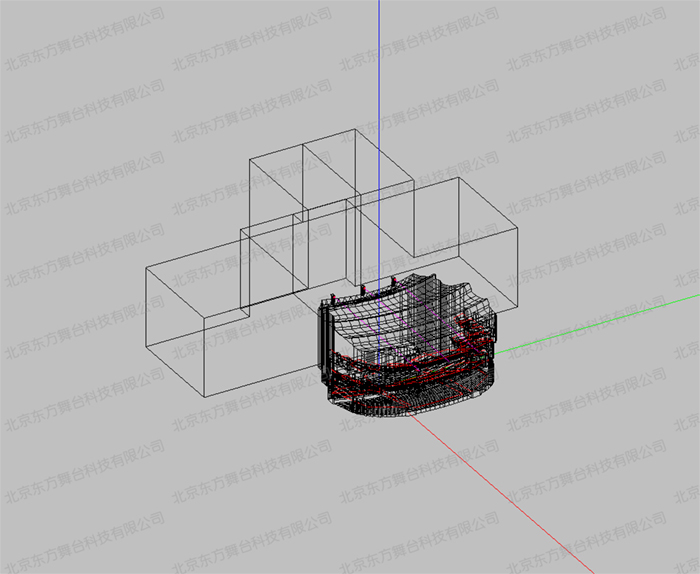
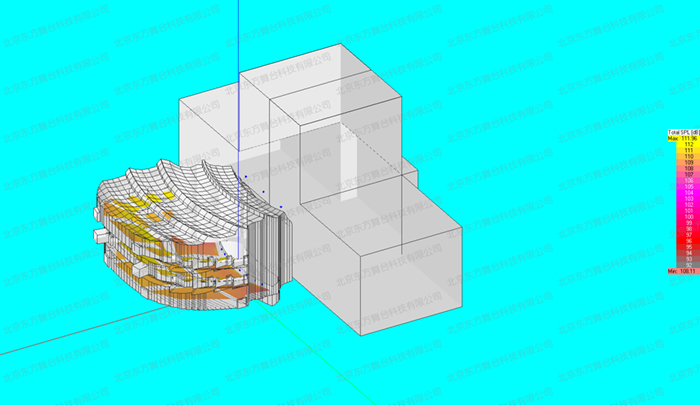
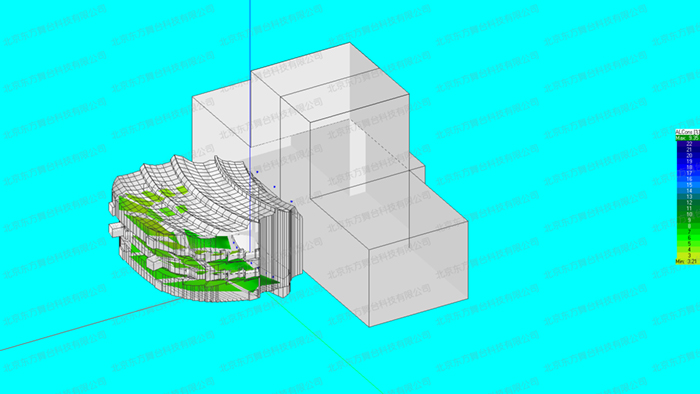
3D model
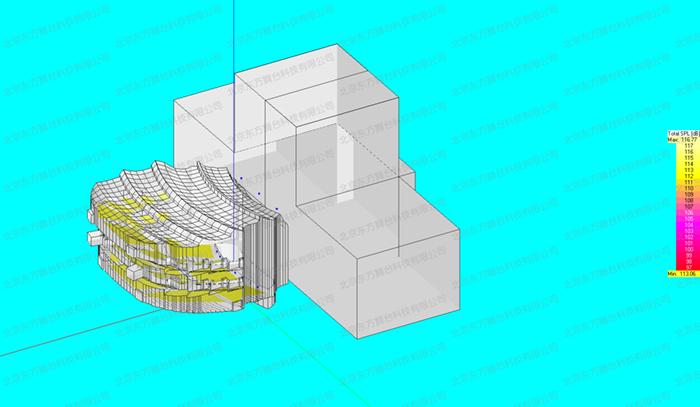
The total sound pressure level of the auditorium 250Hz distribution map
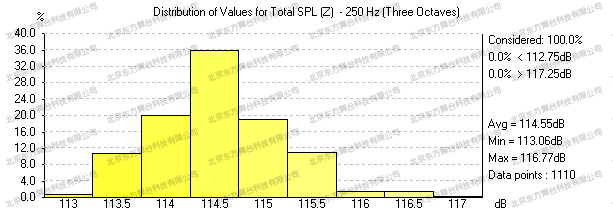
250Hz bar graph of total sound pressure level in auditorium
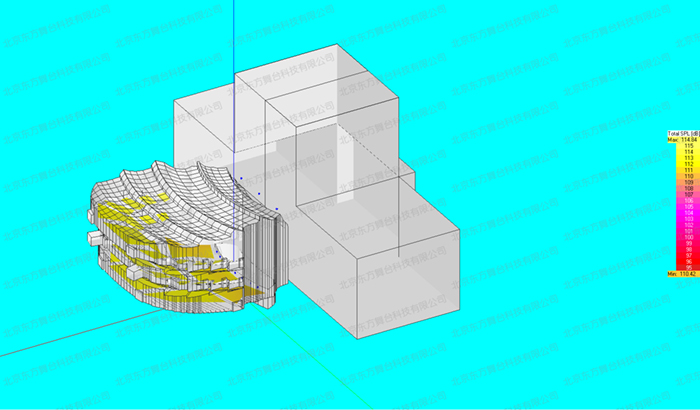
500Hz distribution chart of total sound pressure level in auditorium
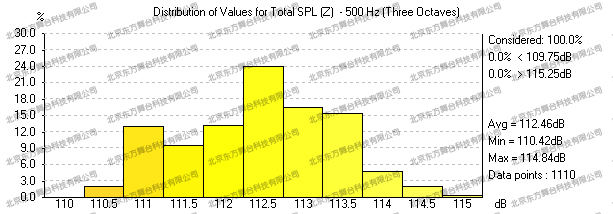
500Hz histogram of total sound pressure level of auditorium
1000Hz distribution chart of the total sound pressure level of the auditorium
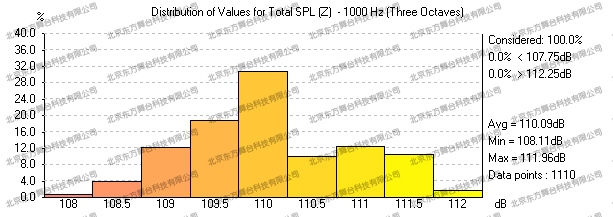
1000Hz bar graph of total sound pressure level in auditorium

The total sound pressure level of the auditorium 2000Hz distribution chart
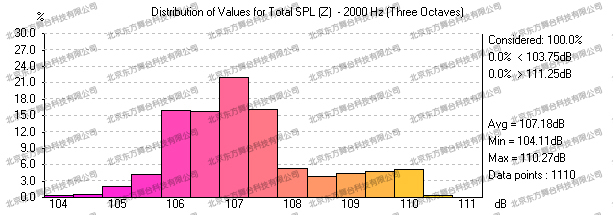
The total sound pressure level of the auditorium 2000Hz histogram
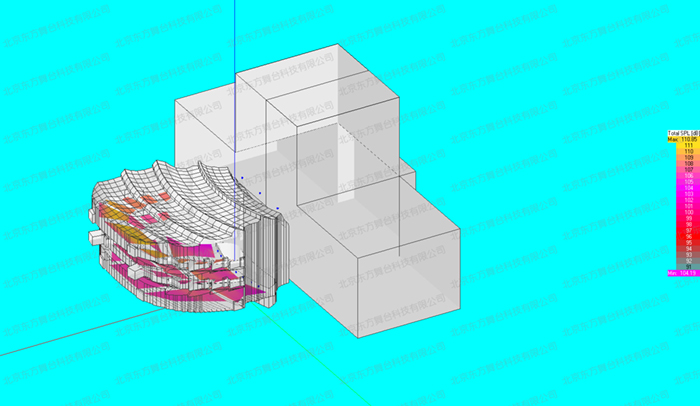
The total sound pressure level of the auditorium 4000Hz distribution chart
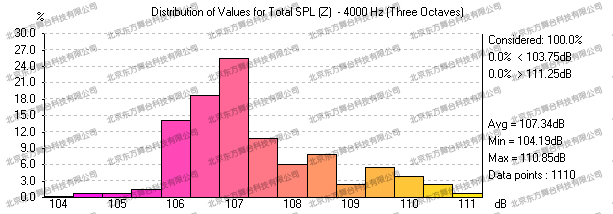
The total sound pressure level of the auditorium 4000Hz histogram
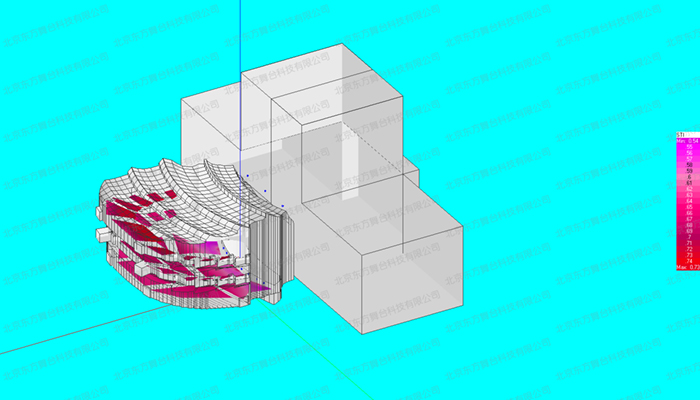
STI speech intelligibility analysis chart
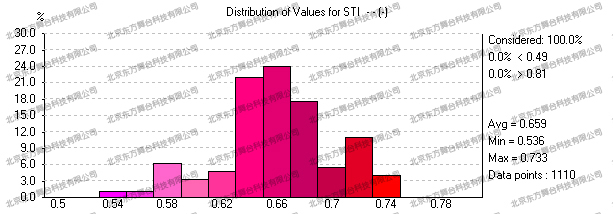
STI speech intelligibility analysis histogram
Consonant loss analysis chart
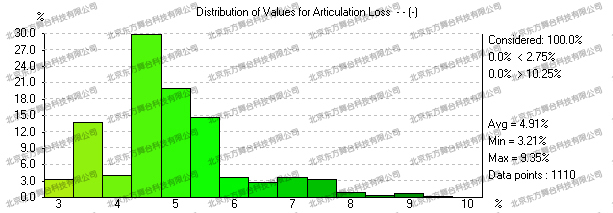
Consonant loss analysis histogram